
Delphi Digital x SecondLane Report: The evolution of digital asset secondary markets 2025
Introduction
Over the years, secondary markets for digital assets have undergone significant structural changes and emerging trends. These shifts have been driven by evolving investor behaviors, the increasing integration of crypto with traditional financial systems, regulatory advancements, and broader industry acceptance. This report, written in collaboration with SecondLane, a private markets–focused, Web3-native investment bank, provides an in-depth analysis of these evolving secondary market themes and their implications.
The themes:
- Secondaries Are Becoming More Mainstream: What began as niche over-the-counter trades has evolved into mainstream liquidity mechanisms via structured platforms, with surging volumes and broader accessibility. The digital asset secondary market is increasingly resembling the robust secondary markets in traditional finance, evidenced by year-over-year increases in deal activity, reduced closure times, tighter bid-ask spreads, and institutional appetite for diversified exposure. These developments position secondaries as a crucial bridge and source of price discovery between primary funding rounds and public markets, fostering more efficient capital allocation.
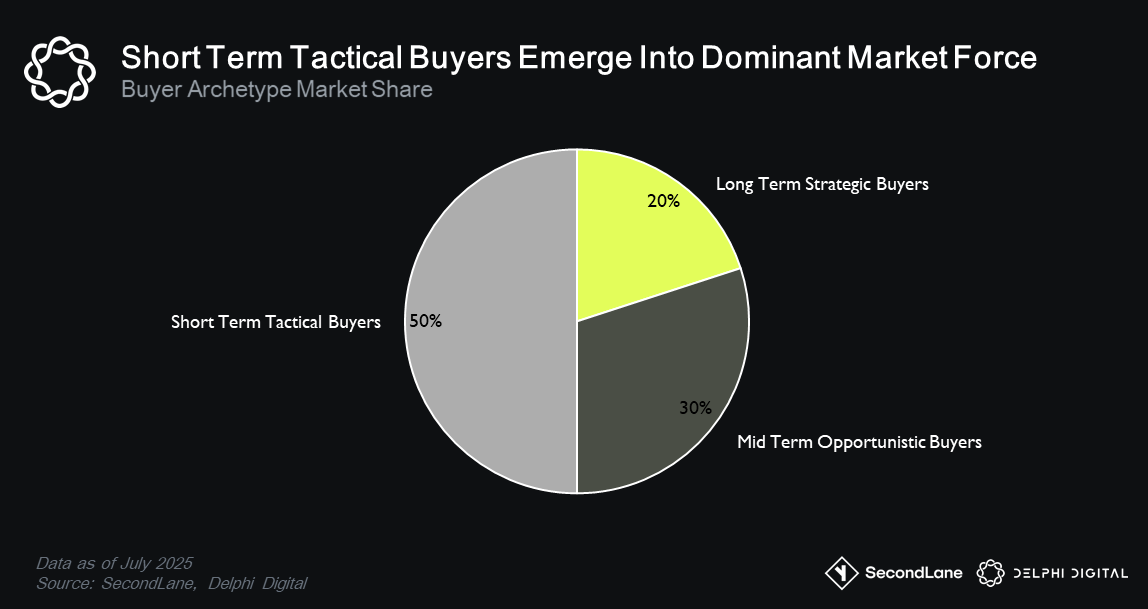
- New Buyers Emerge: The buyer landscape has matured with distinct archetypes, where short-term tactical buyers have become dominant. This shift influences overall composition, exerting downward pressure on deal pricing while accelerating flow. In contrast, long-term strategic buyers and mid-term opportunity seekers are increasingly overshadowed.
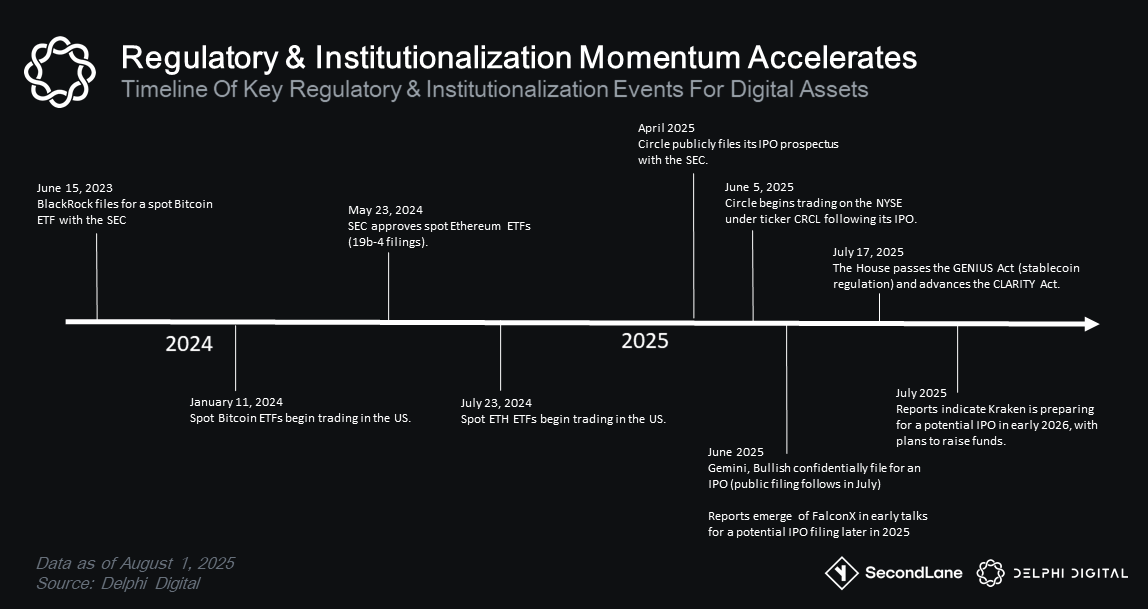
- Regulatory Shift and Industry Acceptance: Developments like spot ETF approvals, the Clarity Act, and the Genius Bill have fostered greater crypto acceptance. With this comes heightened demand for exposure. A pivotal change is the resurgence of crypto IPOs, steering dynamics toward equity structures with clear paths to public listings. These shifts signal reduced regulatory friction, unlocking billions in institutional capital and merging crypto innovation with traditional finance frameworks.
- Cash Flows and Revenue Generation: There’s a pronounced pivot toward projects emphasizing immediate cash flows, such as revenue-generating protocols, DeFi yields, or structured financial offerings. This is evident in the leadership of sectors like blockchain services and tech development. Conversely, consumer-facing verticals like GameFi and social platforms struggle due to limited user traction. These trends emphasize a maturing investor base that prioritizes sustainable projects with tangible revenue (or a path towards tangible revenue) and user traction.
Theme #1 – Digital Asset Secondary Market Continues To Mature
Digital asset markets have evolved markedly over recent years, and the secondary market is no exception. Growth and changes span deal composition, volumes, sector leadership shifts, pricing, liquidity, and overall efficiency. This section paints a comprehensive picture of the secondary market’s evolution into its current state.
Market Composition and Transaction Types
In H1 2025, SAFT deals maintained 54-59% market share, consistent with H1 2024 but with amplified absolute volumes.
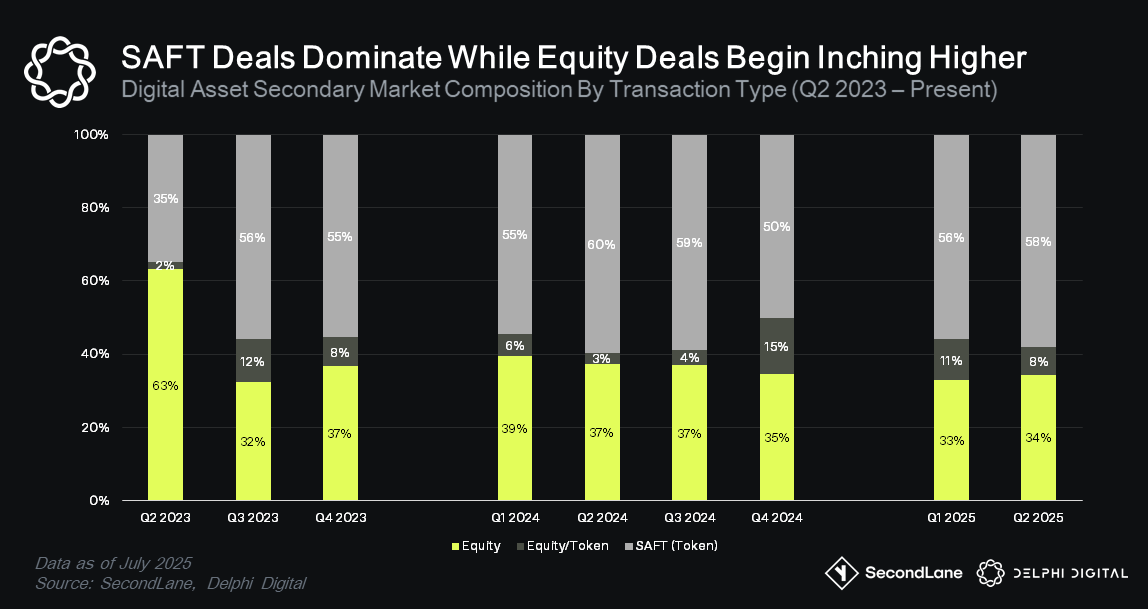
Pure equity deals saw a modest decline, from 36-40% to 32-34%, as buyers navigated regulatory volatility and favored hybrid instruments. Recently, a shift back toward pure equity has emerged post-Circle’s IPO.
The most notable year-over-year delta is in the growth in equity/token mixed rounds, rising from 3-6% to 8-12% market share. This aligns with companies positioning for IPOs and reflects a market adapting to regulatory clarity, with mixed deals bridging crypto innovation and traditional finance stability.
Growth & Seasonality Patterns in Deal Volumes
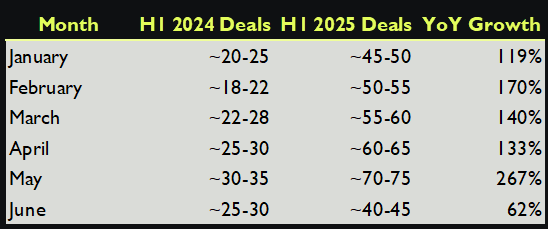
Building on composition changes, deal volumes reflect robust expansion. Activity surged 73% year-over-year, from 131 deals in H1 2024 to 413 in H1 2025. Monthly averages climbed from 100-120 to 220-230, marking 112% growth. Quarter-over-quarter trends showed deceleration: 30-35% in mid-2024, slowing to 15% in 2025 as markets stabilized after the rocky start to 2025.
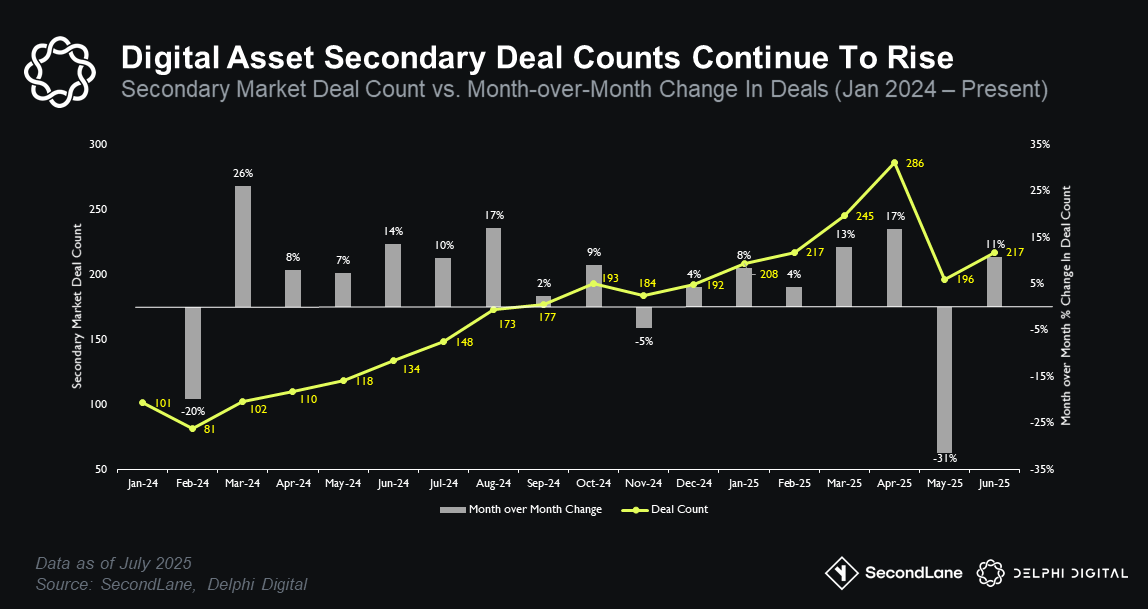
SAFT deals showed the strongest growth at 155-205%, tripling in some categories, while equity deals surged around 250%. Much of this is attributable to ‘large, hot deal’ factors, with peak months typically coming in the back half of the year around late Q3 and Q4.
So far, every month in 2025 outperformed 2024 through the first half of the year.
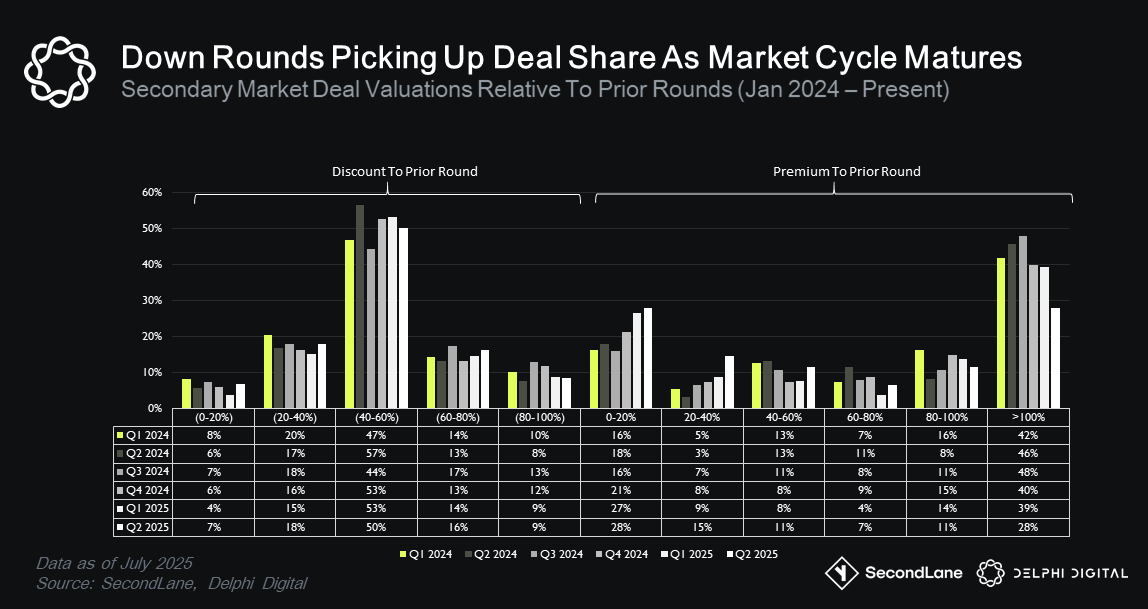
Pricing Dynamics
Overall, pricing trended have trended toward down-rounds consistently over the past 12 months.
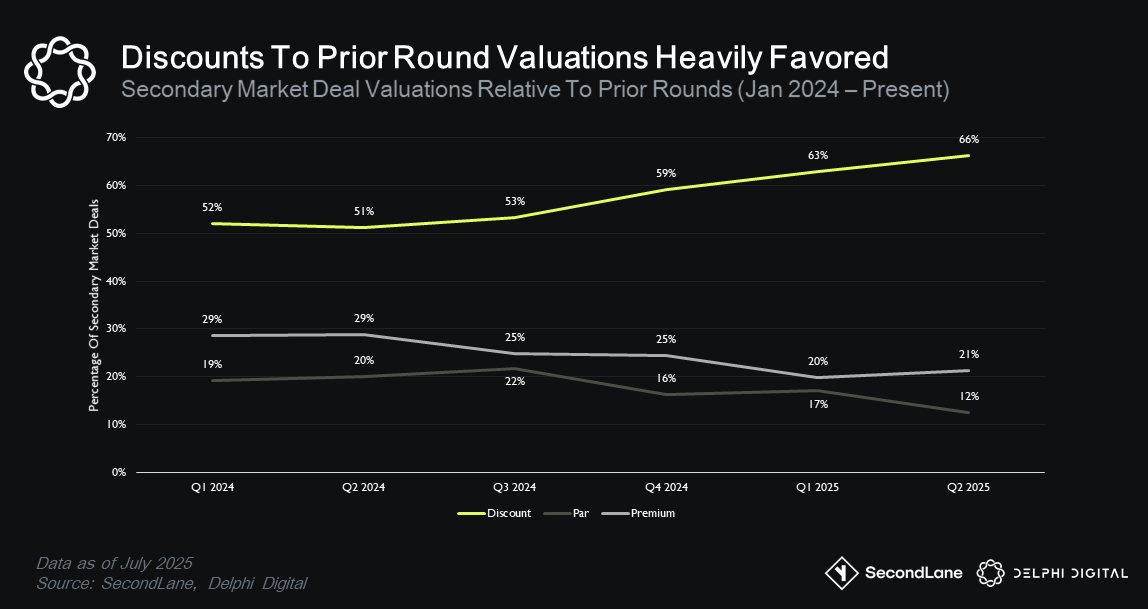
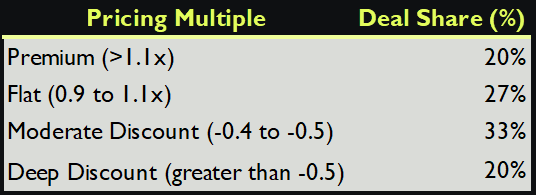
64% of H1 2025 deals came in below previous valuations, a 10% increase from this time last year. Moderate discounts (-40% to -50%) increased from 27% to 33% share, while premiums declined from 29% to 20%.
What explains the shift toward down rounds so far in 2025? A few factors contributing to this dynamic include:
- 2024 Valuation Hangover: Many seed/Series A rounds from Q1-Q2 2024 were priced at bull peaks; 2025 liquidity events marked them to more conservative multiples in line with the reality of the current day market environment.
- Macro Environment and Higher Rates: US Treasury yields averaged 4.7%, weighing on risk appetites.
- Token-Supply Overhang: Large cliffs from 2024 seed SAFTs unlocked in 2025, boosting float and pressuring prices—buyers factor in extra supply with wider discounts.
- Recall the low float/high FDV debates from Q4 2024 and Q33%1 2025.
- New practices like staking locked tokens (team + VC) with immediate unlocking of staking rewards lead to spot market pressures.
- Public-Market Anchoring: Coinbase’s EV/Rev multiple compressed from 11x (Oct 2024) to 7x (Mar 2025), while Circle’s IPO priced ~25% below its 2022 Series E. Secondary buyers benchmark against metrics like these, dragging private marks lower.
- Shift in Buyer Mix: The growing cohort of tactical buyers demand steep discounts to spot markets and prior rounds.
This dynamic illustrates a market recalibrating toward realism after prior exuberance, with public comps gaining more influence.
Liquidity in Early-Stage Assets
Dominance of seed/pre-seed rounds is a defining aspect of crypto private markets, accounting for 82% of offers in both H1 2024 and H1 2025
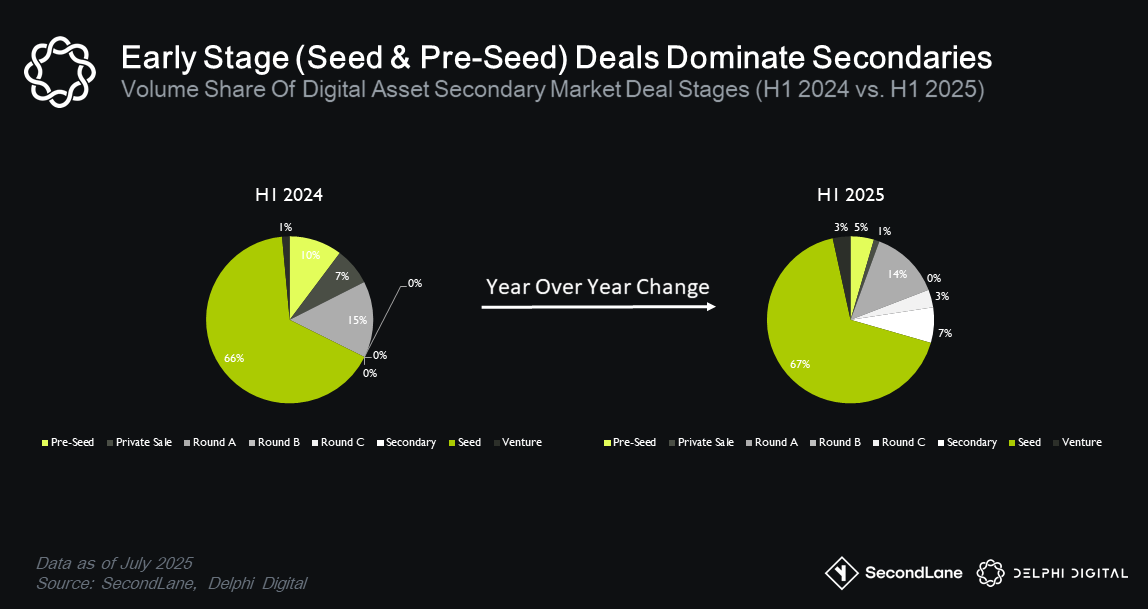
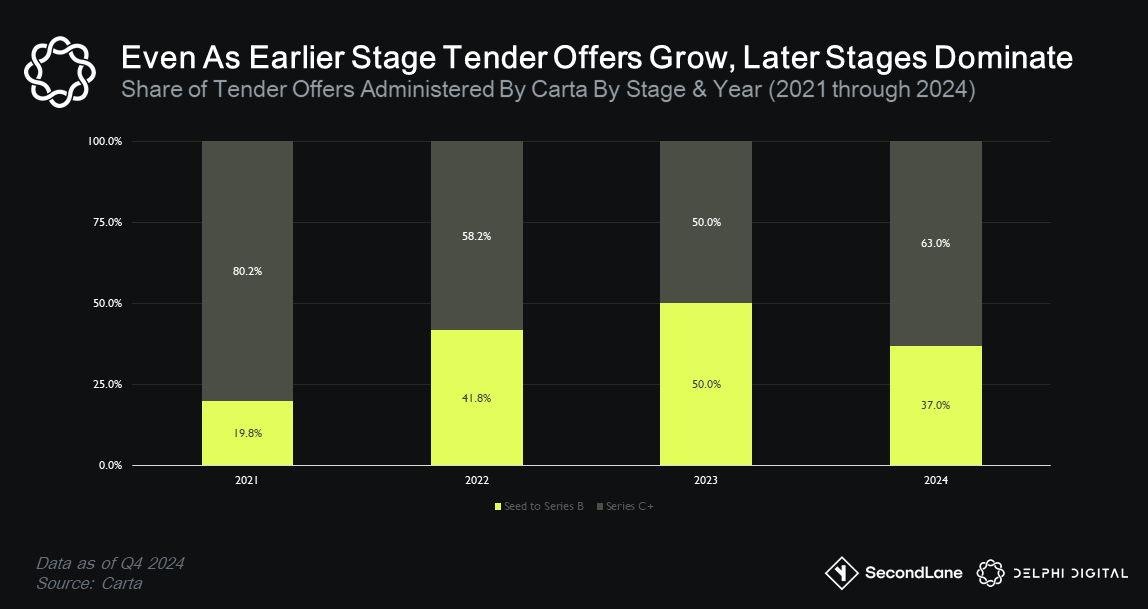
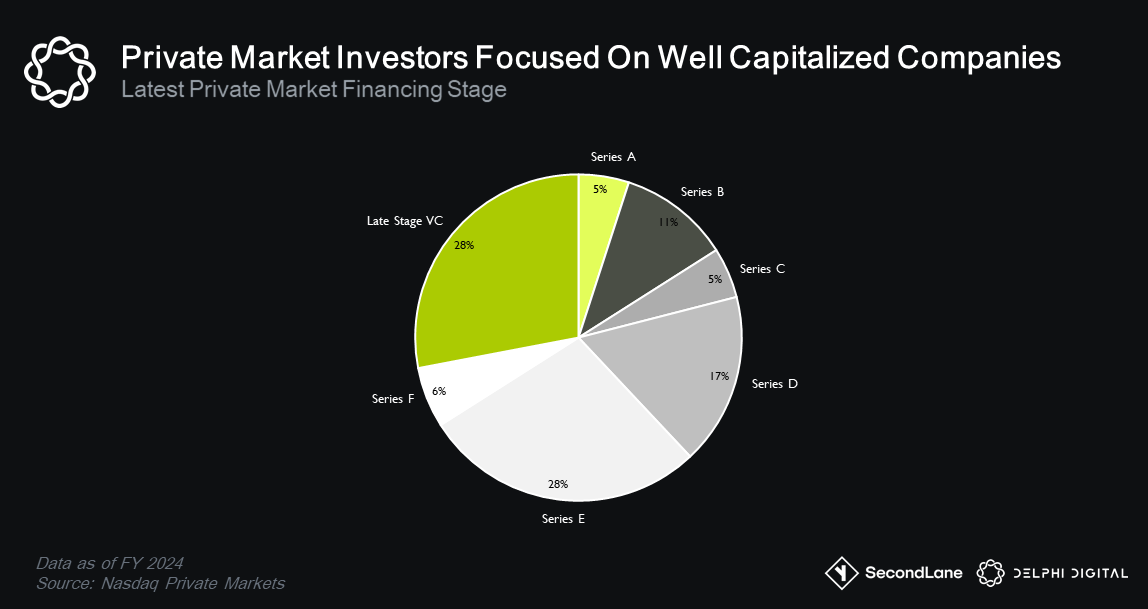
Research from Nasdaq Private Markets reinforces this late-stage skew, with demand concentrated on well-capitalized companies within 12-18 months of IPO.
Crypto’s early token unlocks, SAFT prevalence, and sub-$10 million tickets enable earlier liquidity, tightening time-to-exit (6-24 months) and attracting tactical buyers with shorter horizons.
Shifts In Sector Leadership
Secondary market sector deal composition shifted significantly between H1 2024 and H1 2025.
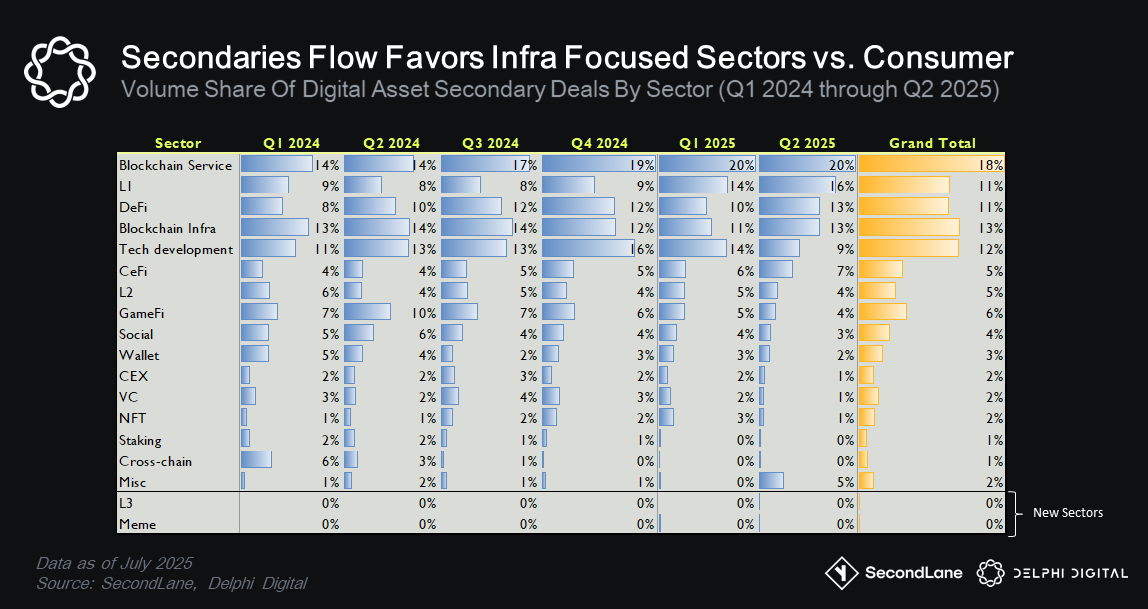
We’ve seen more emphasis toward infrastructure-heavy sectors, with blockchain services retaining leadership at 20% deal share. On the flip side, we’ve seen consumer facing sectors, such as GameFi & Social, face continued pressures.
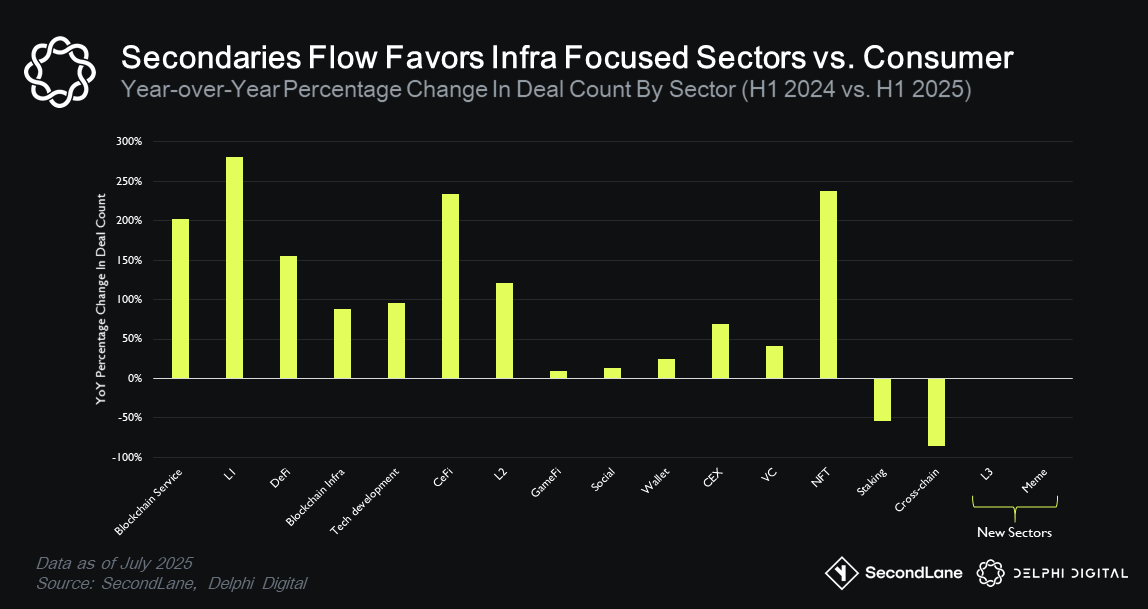
In terms of absolute deal count numbers, we see a similar picture in a year over year comparison between H1 2024 and H1 2025.
Winners in detail:
- L1 protocols emerged as the biggest winner, surging from 9th place to 1st with a 270% increase in deal count while commanding 15% of total secondary market deal flow (up from 3%). This appetite was largely driven by modular narratives, including shared sequencing, restaking, and the post-Celestia rollups trend. High-profile examples include Monad, Berachain, and Eclipse.
- The Tech Development sector nearly doubled in deal count while capturing 35% of the funding share. Average ticket sizes doubling from $10.5M to $19.2M. This shift has been fueled by AI-compute and on-chain data infra narratives, trading at -25% median discounts vs. the average -40% market-wide discount.
- Blockchain Services maintained the overall top position in deal share, while also boasting a strong 200% increase in deal count.
- Blockchain Infrastructure nearly doubled in volume (90% growth) while maintaining steady market position in overall deal share.
Losers in detail:
- GameFi lost significant ground, dropping to 5% deal market share. A ChainPlay review of 3,279 titles found 93 % of GameFi titles to be effectively inactive. Inactive is defined as token price ‑90 % from ATH and < 100 DAU. Deal flow now clears at a ‑55 % median discount to prior rounds.
- CeFi saw general volume share stagnation even as deal counts continued to rise. Regulatory actions plus IPO prep are likely diverting capital into equity rounds instead of token SAFTs for this category.
- Social platform deal share declined 3% deal market share with a -21% volume share drop. Despite platforms like Farcaster surpassing 500k registered users, daily actives remain more stagnant.
- The Staking category has nearly disappeared from secondary market deal flow, falling from 2% to 0% deal share, with a 50% decline in overall volumes.
The takeaway? Capital is consolidating around sectors that can capture economic value while consumer‑facing verticals face a tougher funding environment unless they demonstrate breakout user traction. Collectively, these shifts underscore a maturing market resembling something more akin to traditional finance markets.
Theme #2 – Emergence of Distinct Buyer Archetypes
Perhaps the most interesting dynamic in the past year’s digital asset secondary market has been the emergence of distinct buyer archetypes. This diversification has shaped the market, introducing varied horizons, strategies, and influences.
These archetypes include long term strategic buyers, mid term opportunistic buyers and short term tactical buyers.
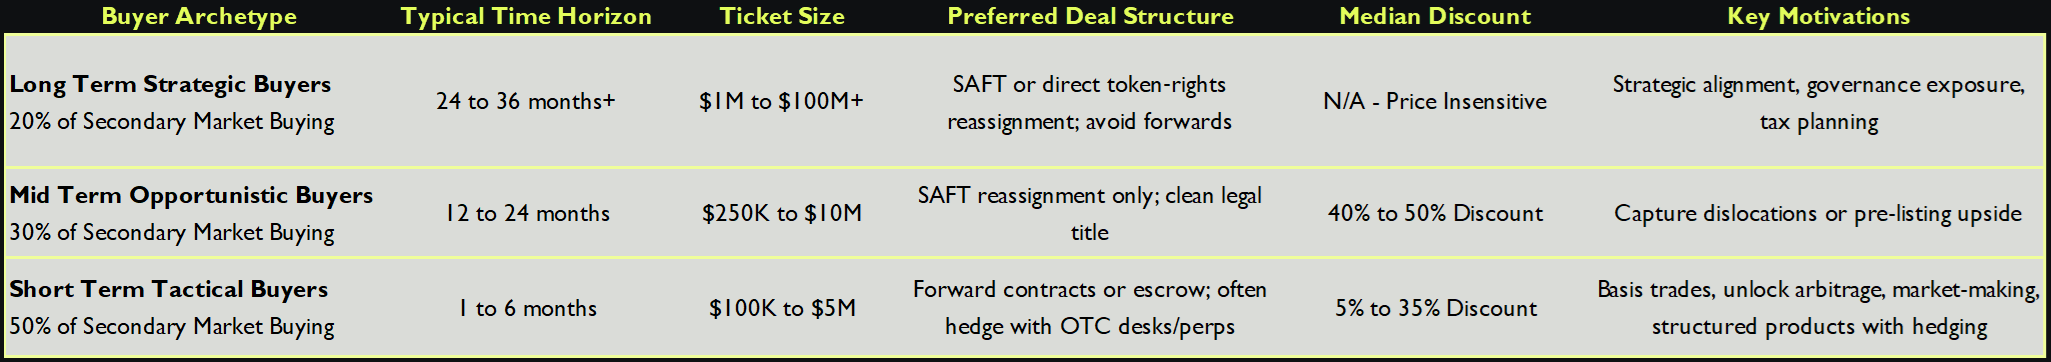
The short term tactical cohort was effectively absent in prior cycles. This can be explained by the rise of structured‑forward desks and perp‑hedging strategies, which is essential infrastructure for these types of participants. The short term tactical cohort’s need for rapid turnover helps explain the compression in deal maturity (56 % of deals closing in less than 1 month in 2025). Mid‑term buyers fill the gap when discounts reach 40 %+, while strategic allocators dominate jumbo blocks that require extensive KYC and legal work.
These archetypes collectively impact deal flow and exert market influence in a number of ways:
- Pricing: Tactical bids set the floor for short‑vesting deals; strategic demand supports premium prints in highly sought after rounds.
- Liquidity: The entrance of basis‑trading funds has doubled order‑book depth in sub‑6‑month unlocks, but also widened the bid–ask for illiquid longer term SAFTs.
- Structure innovation: Growth of forwards/escrows is directly tied to tactical buyer preferences, while larger strategic blocks still close via traditional SAFT assignments.
Theme #3 – Regulatory Acceptance & The Crypto IPO Trend
The crypto IPO trend is gaining momentum amid growing regulatory acceptance over the past 12 months. This reshapes secondaries by clarifying paths to public markets for top crypto firms.
The Path to Public Markets & The Circle Catalyst
Circle’s June 5, 2025 NASDAQ IPO, the first major crypto IPO since Coinbase, has lit the spark for institutional appetite. We’ve seen confirmed filings for Kraken, Gemini and Bullish. We’ve also seen speculation emerge around names like FalconX and a handful of custody and RWA names exploring a 2026 IPO timeline (although there has been no public valuation/trade data for these names as of yet). This appetite helps to explain the growth in mixed rounds as firms prepare for these listings.
From January through May 2025, Circle shares changed hands on secondary platforms at around a $5.0–$5.25 B valuation, with ~$110 M cumulative volume.
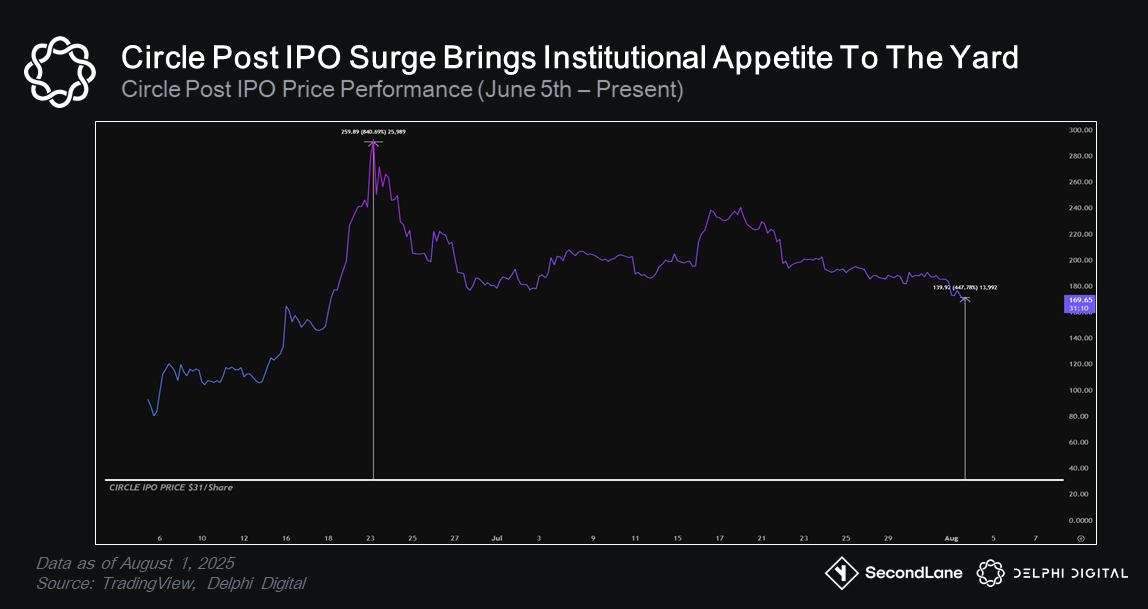
Circle’s IPO was eventually priced at $31 (or about $6.8 B valuation). Day one trading opened at $69/share, before peaking at over $200/share in the ensuing weeks.
Sellers who exited via secondary markets in the months before Circle’s IPO missed out on tremendous upside during Circle’s post IPO price surge. This has prompted buyers to rotate into other late-stage names, hoping to catch a similar rerating.
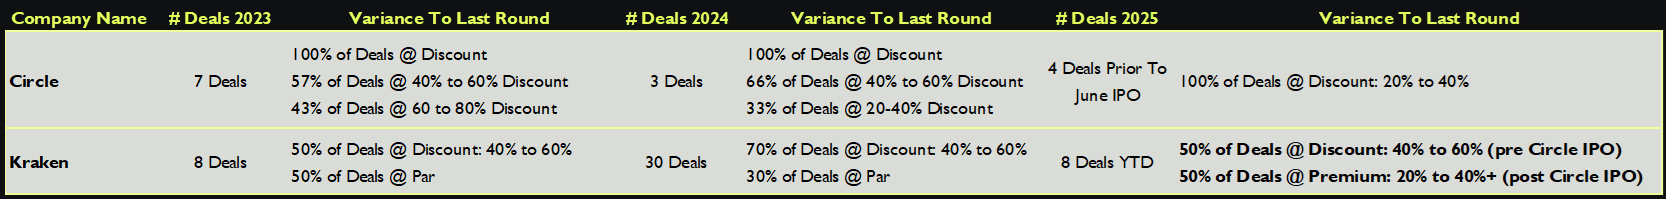
Circle’s Knock On Effects – The Kraken Liquidity Surge
Kraken’s confidential IPO filing in early 2025 has triggered a significant spike in secondary market activity, making it one of the most closely watched pre-listing assets.
As of June 30, 2025, Kraken’s secondary shares were valued at a $6.82 billion (and has since moved higher, exceeding $7.7 billion). This rerating is not simply theoretical – it is based off of actual trades, bids, and offers totaling $750 million in the last 90 days.
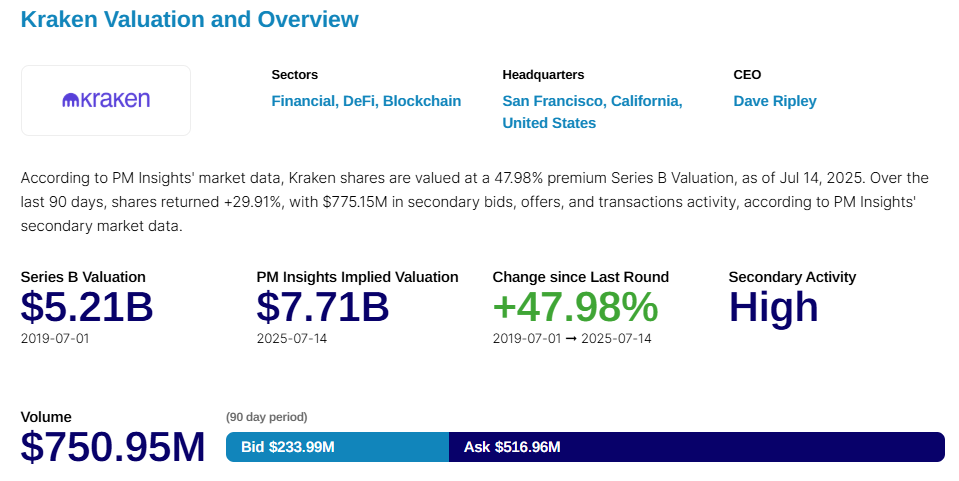
Kraken’s positioning as a fully regulated U.S. exchange with international reach makes it a natural candidate for pre-IPO speculation. The stock’s strong performance in secondary markets reflects this narrative, particularly after Circle’s successful public debut.
Implications for Secondary Markets: Are Equity Deals Poised To Dominate?
Equity rerating is now becoming the benchmark. Circle’s rerating post IPO and Kraken’s rising secondary market valuations will become the public market comps. Bankers are already using Circle’s pre-IPO price ranges as an anchor reference in discussions for similar names like Kraken and Gemini.
We are also starting to see capital rotating toward late-stage equity, as mentioned earlier in this report. Secondary market platforms like Forge and PM Insights reported tighter bid-ask spreads on late-stage equity deals, with a noticeable uptick in inquiries for pre-IPO crypto names. Forge now publishes pages for both **Circle and** Kraken, something it activates only after recording regular secondary trades. PM Insights maintains open bid/ask dashboards for both exchanges.
There is a current backlog of equity deals; Kraken, Gemini, Bullish (all three filed) and FalconX (still rumored).SecondLane’s data shows that equity’s share of new mandates increased modestly from 33 % (Jan–May) to 34 % (Jun–Jul). While small, this change points in the same direction as the qualitative shift visible on other platforms like Forge and PM Insights.
The bottom line? Given a live IPO benchmark in Circle, and absent a typical alt season/broad market token rally, it appears as though late-stage equity deals are very likely to keep absorbing a larger share of secondary-market through year-end, potentially reshaping secondary markets for some time to come.
Why Does This Matter?
Regulatory Catalysts Drive Adoption
In essence, regulatory developments expands institutional participation, which we expect to see grow through year end and beyond.
Developments like the Clarity Act offer stablecoin registration paths. We will be keeping an eye out for custodian approvals for SAFTs, pilot programs from various pension funds (for example, Wisconsin/Michigan ETF buys), and >$100M secondary buys as confirmation of this trend.
Market Consolidation and Access
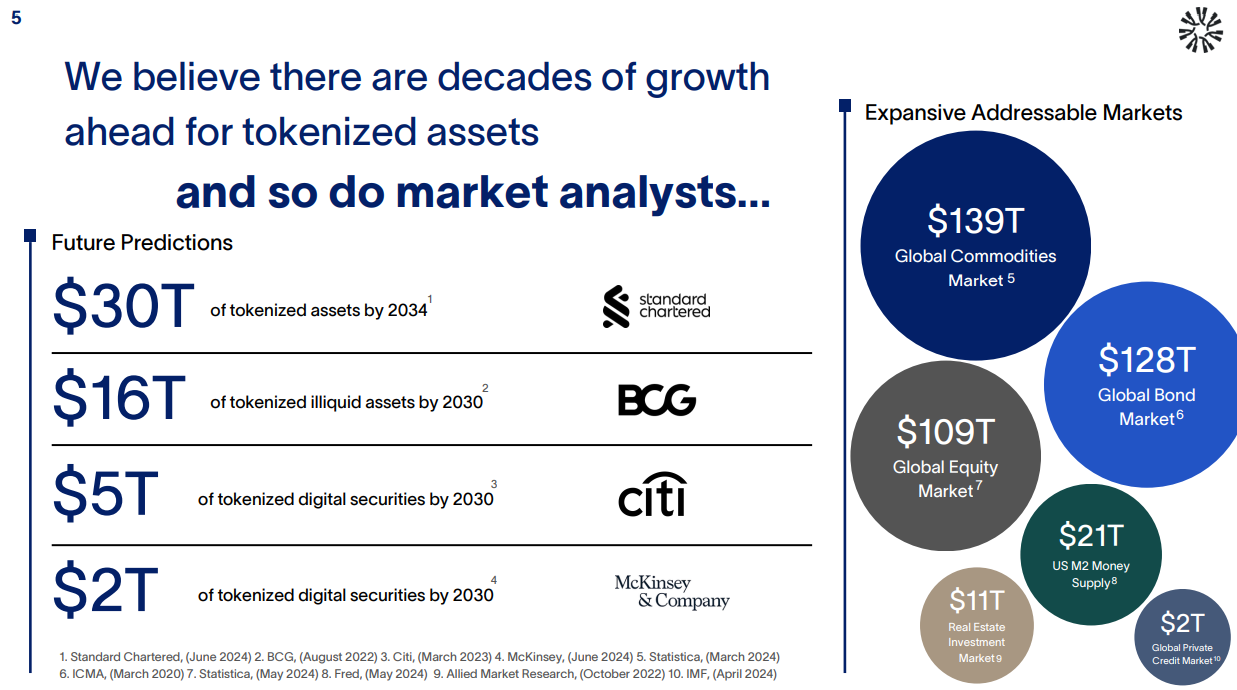
Private markets have a distribution saturation problem. Large, private companies are tapping into a limited pool of deals, competing with crossover funds and sovereign wealth funds. At the same time, retail & smaller institutions remain locked out of many of these deals due to size limitations (among other things).
Tokenization is seen as a release valve for this dilemma, and is likely part of the reason why tokenization and new instrument creation is being so heavily pushed by these large players.
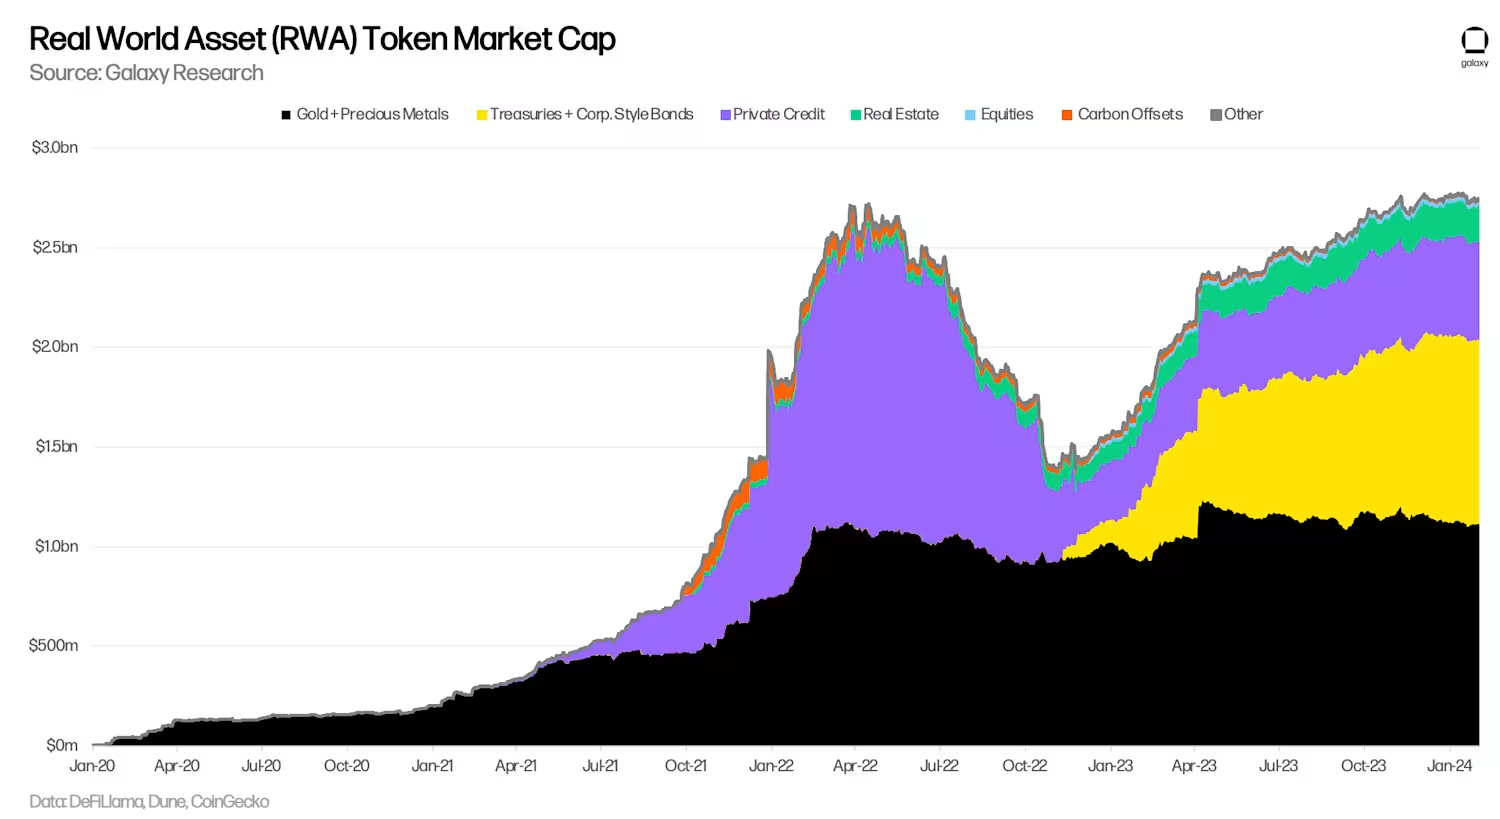
- BlackRock’s BUIDL: $2.9B AUM by through June (41% of tokenized Treasuries), up from $1B in March.
- Tokenized Treasuries overall: $7.4B, +80% YTD.
- Private Equity firms like KKR (tokenized Growth Fund on Avalanche with minimum tickets ranging from $5M to $100k) and Hamilton Lane ($2.1B feeder fund on Polygon with $20k minimum tickets) tokenizing their funds.
- Bank Infra: J.P. Morgan’s Onyx processed 10x more tokenized-collateral trades in 2024.
Projects such as Legion & Echo are also enabling retail participation in private markets. We expect this trend to continue well into the future (we are also seeing firms like Robinhood allow retail participation through the requesting of IPO shares).
Quick Fire Predictions For 2025 and Beyond
- Surge in secondary equity rounds for pre-IPO infra (e.g., Kraken, Gemini, etc).
- Discount compression below -30% for top-tier L1/infra as short term tactical capital continues to put pressure on deal flow.
- Acceleration of tokenization and more wide spread participation among sophisticated investors and retail alike.
- Institutional appetite beyond the ‘major’ digital assets will continue to grow
Closing Thoughts
The secondary market for digital assets has seen incredible maturation since its humble beginnings just a few short years ago. As a source of price discovery and barometer of institutional demand, the trends in private markets are increasingly important for investors to understand.
The sizeable number of deeply discounted deals is in part attributable to the arrivals of new tactical buyers, while the resurgence of crypto IPO fever is driving up secondary values for the next wave of institutional darlings.
Akin to the divergences we see in the public market, the bifurcation in demand for sectors like infrastructure and tech development – specifically deals tied to major secular tailwinds like AI – are garnering the most interest.
Compared to prior cycles, companies and startups now face a verdict of being “guilty until proven innocent”. Those who can show real traction and a real path to capturing economic value are rewarded, at the expense of out-of-favor sectors like consumer apps and GameFi. This is another further sign of market maturation.
Once a small web of OTC desks and crypto-native buyers, the secondary market has grown to become a mainstay for larger capital allocators. As the lines of liquidity across private and public markets continue to blur, it opens the door for more sophisticated players to get exposure to crypto, in ways that more closely align with their unique spectrum of mandates, time horizons, and risk appetite.
SecondLane x Delphi Digital