
The network oracle: how private intent leads public price
Most investors spend their days staring at the flicker of public exchange prices, treating spot market data as the ultimate truth. But when it comes to institutional digital assets, public prices are a lagging indicator. They tell you where the market was, not where it is going.
To find the true leading indicators, you have to look where informed capital lives: within community networks of the secondary market makers.
As matchmakers between TradFi and the crypto frontier, we monitor over $3B in secondary opportunities across our network. By synthesizing these signals, we often see market shifts days or weeks before they reach a candlestick chart.
This allows us to act as a market oracle rather than a simple intermediary.
The $100M Solana lead: a case study in secondary intent
To understand the predictive power of secondary data, consider a window in the Solana ecosystem in early 2026.
On public exchanges, the price was stable, while the signal from our network was unmistakable. In the 72 hours before the move, we received over $100M in secondary demand.
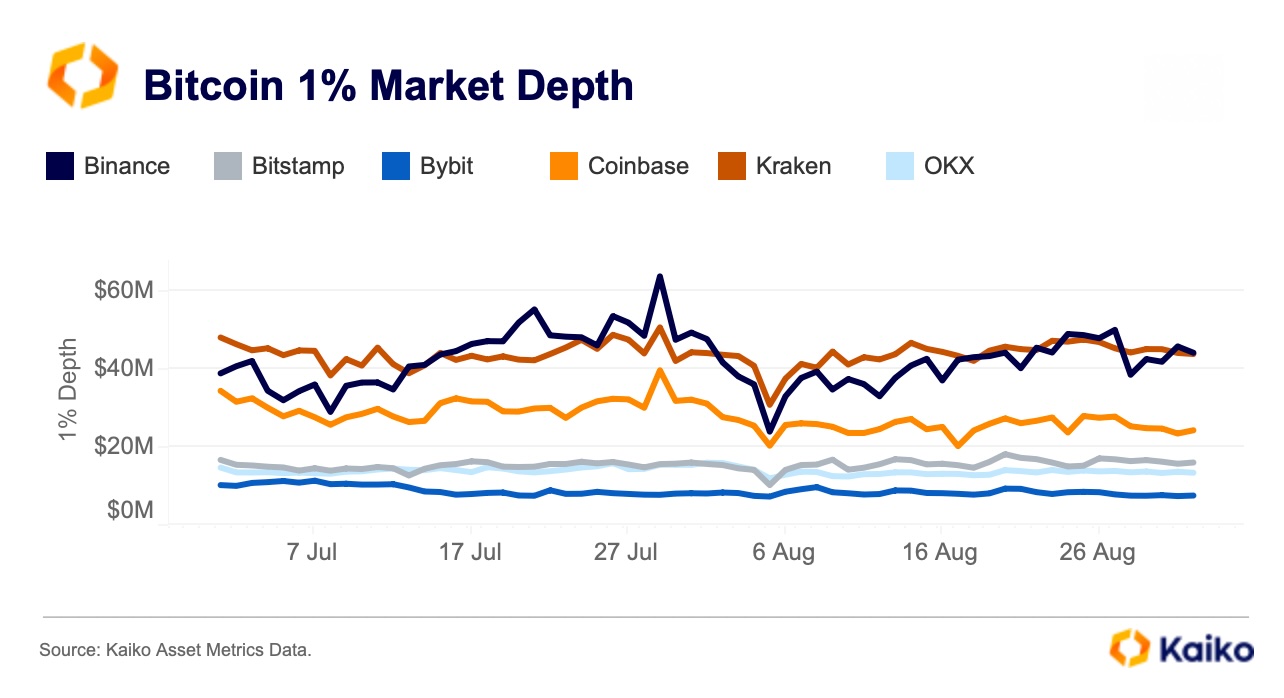
Institutional buyers sought liquidity privately. Why didn’t they go to public exchanges? According to Kaiko Research, the 1% market depth on public exchanges for high-cap assets like Solana often means a single $20M market order can trigger significant volatility. These institutions were using private matchmaking to avoid the “slippage tax.”
When buy-side intent concentrates while sellers vanish, you are looking at a coiled spring. In the secondary market, you see the spring tighten before the price snaps. By the time the retail market discovered the trend, the institutional alpha had been secured.
Why is secondary market data more honest than exchange volume?
Public exchange volume is noisy. It is an open secret in the industry that “the tape” is often an illusion. A 2025 report by Columbia University estimated that as much as 25% of Polymarket’s trading volume was driven by wash trading. In the same year, Chainalysis identified over $2.57B in wash trading globally.
Markets are often incentivized by their own portfolios and the venue itself. If the maker or the venue lacks integrity, the volume on your screen is a ghost.
The secondary environment operates differently. It is driven by real intent. When an institutional player enters a network, they are deploying high-intent capital. Participants typically fall into three categories: those adjusting portfolio exposure, those responding to liquidity needs, and those seeking exposure to blue-chip assets at a scale not achievable through public exchanges.
This data is honest because it represents the creaking of floorboards before the house moves.
Reading “social pain” as an ecosystem indicator
Network data diagnoses the health of sectors through “social pain” — the measurable desperation of sellers.
Consider the divergence between Gaming and AI over the last 24 months. While public token prices stayed elevated on retail “vibe-trading”, the secondary market showed a vacuum — everyone wanted out, and nobody wanted in.
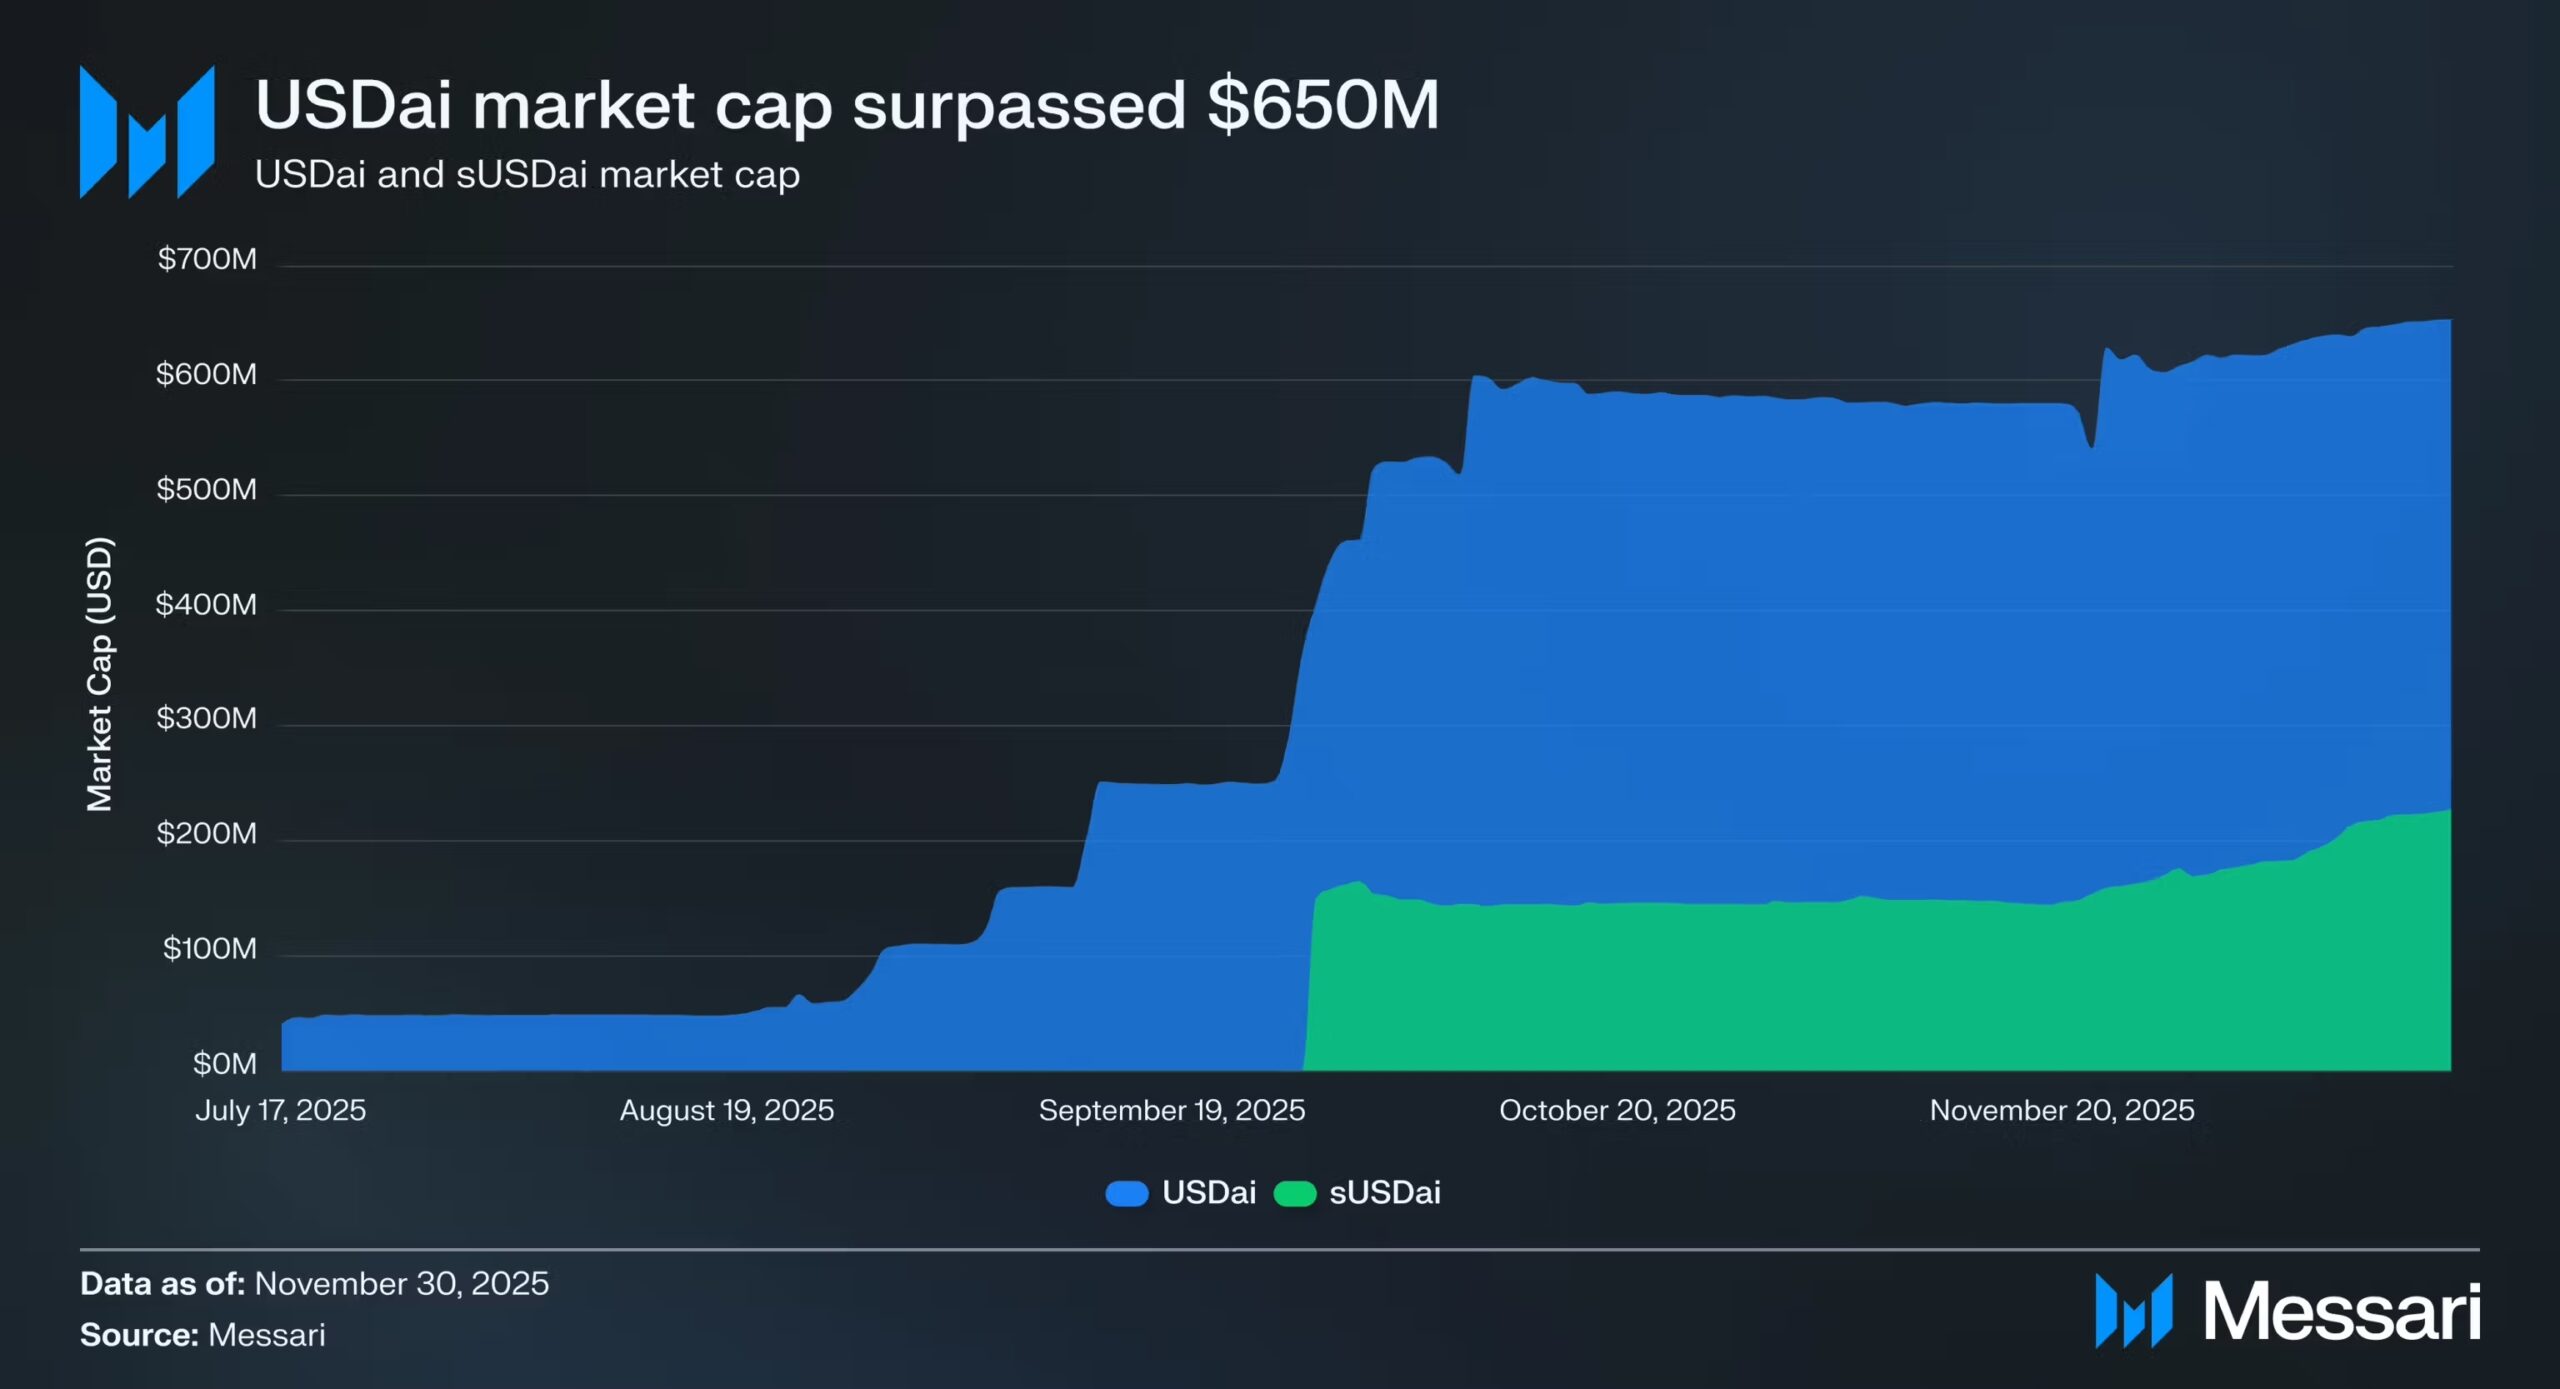
As Messari’s recent research confirms, institutional interest has shifted toward decentralized AI infrastructure, the market for which is projected to reach $758B USD in spending by 2029. USDai, a synthetic dollar protocol that finances AI infrastructure via GPU-backed loans for emerging AI companies, has already reported a Total Value Locked (TVL) of $658M.
In our network, the lack of secondaries supply for AI-related assets is like never before. Which double-proves it’s not just hype; when an asset is “hot,” the secondaries supply for that asset dries up completely. That is a clearer signal of a project’s horizon than any social media trend.
Secondary intelligence as a due diligence engine
Investors often mistake secondary signals for direct instructions. These signals are hints, not orders. A large secondary supply interest is a reason to look “under the hood.” One must ask: is this a forced opportunity reflecting an entry point, an insider signaling a failure, or a fund looking to derisk?
Institutional reality supports this shift. Lazard’s research indicates that secondary pricing is the new “fair market value” anchor for private assets. In 2025, 67% of single-asset secondary opportunities were priced above 95% of their Net Asset Value (NAV). When private pricing is that consistent with real value, these signals become a filter to separate retail noise from conviction.
The public market is the theater; the secondary market is the backstage. To know what the next act looks like, watch the actors before they step into the lights.
Omar-Shakeeb Zahir, CEO & Co-Founder SecondLane